Inference Profile
The inference mode of @scope profiles Julia's type inference while an expression runs, using SnoopCompileCore.@snoop_inference, and opens the viewer with the inference timing tree:
@scope inference exprThe frame costs are shown as inference plus LLVM compilation times, and the tree can be navigated exactly like a runtime profile. The value of expr is discarded.
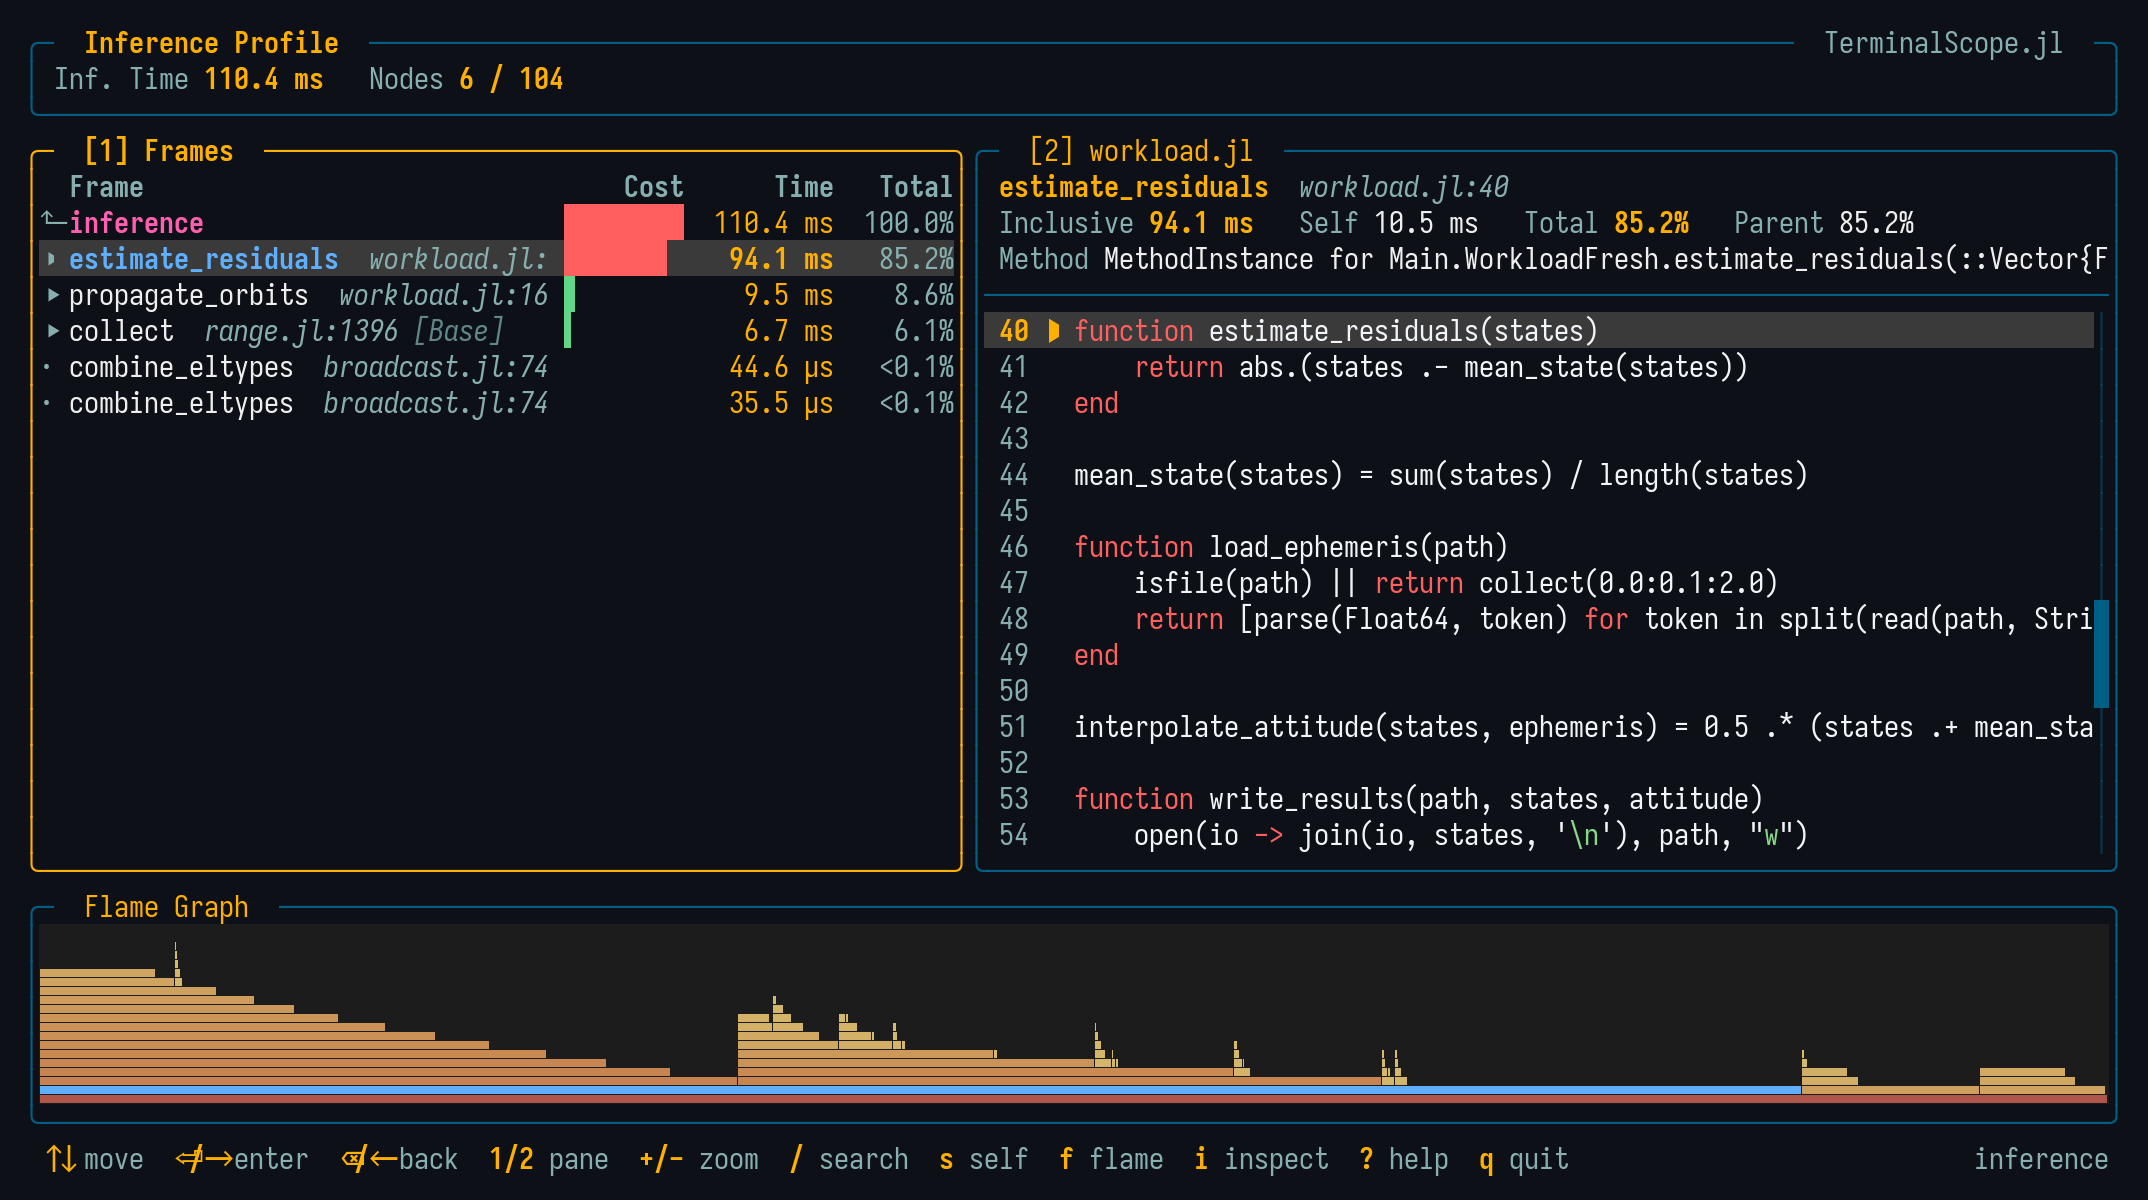
The times scale automatically from minutes down to microseconds and nanoseconds, so fast inference frames keep a meaningful cost instead of rounding to zero.
Like the runtime profile, the viewer supports the flat self-time view (s) and, on graphics terminals, draws a flame graph of the inference tree along the bottom of the screen (see Flame Graph).
To capture the inference cost of the first call, expr must contain code that has not been compiled yet. Run this mode in a fresh session for representative results.
Viewing Collected Data
scope_inference(tinf)opens the viewer for the timing tree tinf returned by SnoopCompileCore.@snoop_inference.
Examples
julia> using TerminalScope

julia> @scope inference my_uncompiled_pipeline()

julia> tinf = SnoopCompileCore.@snoop_inference first_call();

julia> scope_inference(tinf)